This work was done during the suite2p workshop organized by Dr Marius Pachitariu and Dr Carsen Stringer with the help from both of them and other workshop participants. Kudos to all of us!
A lot of labs are interested in looking at the activity of the same cells across days. One of the easiest solution (and which works well) recommended during the workshop was to concatenate the imaging data from multiple days and run the suite2p algorithm on the concatenated data. The results looked pretty great for four different datasets we tried. Although this works well only when the images across days have small degree of misalignment (needs more quantification).
We came up with an alternative methods for larger misalignment. This was the proposed solution:
1.Run suite2p algorithm to find ROIs on each session.
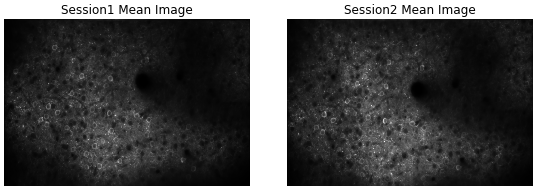
2.Retrieve the meanImg from the ops file for each session.
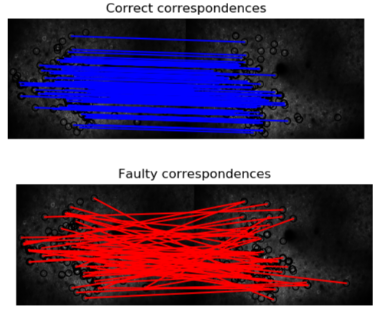
3.Detect features on meanImg from each session and find matching features. Sometimes, the features detected can be noisy. To clean those up, we used probabilistic modeling (RANSAC) to find only consistent matches.
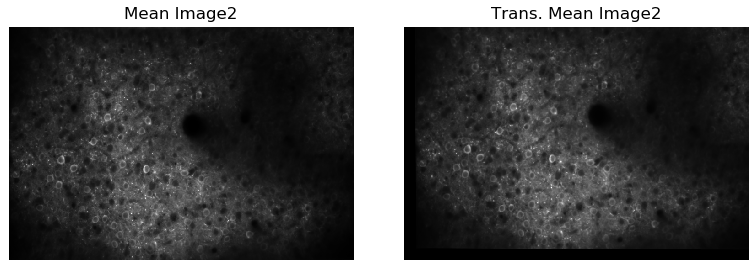
4.Using these consistent features matches, find the transformation matrix between the two sessions. Warp the imaging data from the target session to the reference session coordinate sytem using the transformation matrix.
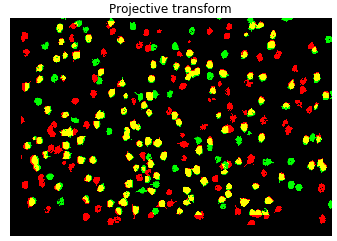
5.Warp the cell ROIs from the target session using the transformation matrix to align with the reference session ROIs. Now compute the overlap between the two groups of ROIs. In the image below, yellow, red and green represent the overlapping ROIs, session1 ROIs and session2 ROIs respectively.
To run the above algorithm, you will need ops.npy and stat.npy file from both the session along with the scikit-image package for image processing steps. The script is available HERE


